Stay Fully Invested
Market timing is a subject of much debate. Many studies have tried to debunk it in the short term. At the same time, when the time horizon is elongated, it appears hard to argue against it. Due to the long-term nature of such periods, it appears that this long-term market timing may be a little understudied and thus present some positive opportunity to those who understand it. You don't have to be a staunch advocate of market timing to play into some of its merits. A good common ground is to stay fully invested but use leverage to opportunistically add to portfolio returns.
Conventional market timing is typically played out in the form of switching into stocks when the stock market looks cheap relative to T-bills and, when it looks overvalued, doing the opposite. The strategy we are discussing incorporates leverage into the equation rather then buying T-bills, which provides great expected returns. However, we suggest mitigating risk by playing percentages and only using leverage up to a certain degree so that catastrophic risk of bankruptcy is avoided.
The Strategy
In this strategy, we stay fully invested in stocks all the time, but use a very diversified ETF as a broad equity proxy. Quite simply, the chance that every stock in the ETF's corresponding index will go bankrupt is next to impossible. If your investment in such a diversified vehicle goes to zero, you have bigger problems along the lines of economic Armageddon!
Once you have your investment vehicle in place, you can opportunistically add to it when valuations present themselves. The amount of leverage to use is based on the relationship between the valuations of the investment vehicle relative to the underlying economic underpinnings upon which its valuation is based. One measure is the S&P 500 relative to the U.S. GDP. However, a more global measure may be a total world index relative to a global output measure.
When the equity measure appears to be at a peak, the suggested leverage capacity to be used would be zero. Similarly, when the valuation measure is near the bottom, a higher leverage capacity may be used.
Leverage Capacity
To be safe, the only debt that should be used in this strategy is home equity debt. If you are carrying other high-interest debt (such as credit cards), you should not be investing in the market; saving on interest expense is a better risk-adjusted investment than what can be expected in equity investing.
If mortgage debt is your only debt, your financial condition is probably pretty healthy. Moreover, homes hold their appreciation value better than most investments and are hard for banks to take away due to foreclosure laws. Conversely, margin debt can be called any time you fall below the high margin levels dictated by brokerage companies. Long story short, you have time for irrational pricing to correct without finding your debt a burden.
How It Works
Here is an example of a leverage matrix for illustrative purposes.
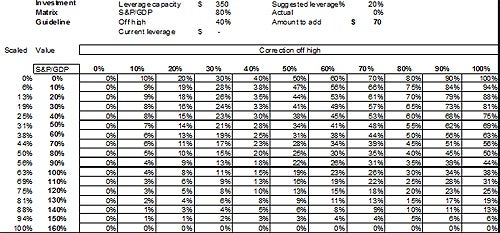 |
| Figure 1 |
The leverage matrix calculates a suggested leverage percentage based on two variables: the ratio between S&P 500/GDP and the current market correction off the high. The level of overall debt you carry should correspond to the overall value level of the market. The cheaper it is, the more you invest, and vice versa.
Let's say the S&P 500/GDP ratio is 80% in conjunction with a market that is 40% off its high. The matrix would suggest that you use 20% of our leverage capacity. Now if you have a home equity line of credit of $350,000, this would mean that your level of investment would be $70,000.
Let's look at what you have here. First, the value of the market looks somewhat cheap based on the value driving GDP. So clearly, some opportunity exists on a long-term basis. Moreover, when the market is off its high by 40%, some relative value appears present on a short-term basis. By having two measures pointing the same direction, the investment seems smart.
Now, let's examine what to do from here. If the market valuation goes up such that the S&P 500 is now 90% of the GDP, the matrix would suggest we trim our debt capacity to 18% and pay down some debt with free cash flow, which could be dividends, ordinary income, etc. Conversely, if the market falls another 10% revealing correction of 50% off its high, another trigger point is met whereby short-term value and long-term value are present and the end result is the ability to buy more stock at cheaper prices. Here the debt capacity level suggested by the matrix would be 25%, or $87,500.
Realistically, little debt will be used unless severe valuations are present. For example, when the market corrected significantly in 2009, the max leverage capacity would have been maybe around 35%.
Keep in mind that this matrix is simply an example of a leverage matrix and should not be used as a concrete guideline to your own investing decisions. Your risk profile as well as investment goals should be taken into account before making any long-term investing decision.
The Advantages of This Strategy
This strategy works because you are optimizing leverage by letting the market fall before you invest, giving you extra cushion on top of the line of credit. As the market rises, pay down the home equity line of credit. As the market falls, pull down on the line of credit and invest. The interest expense is tax deductible against investment income. Looking at simple after-tax expected rates of return – historically, these are 9% in the market versus maybe 1% over the consumer price index (CPI) investment interest expense. The key is to keep leverage moderate in order to ride out fluctuation in these expected rates of after-tax return. The investment trade looks good if the market is not overvalued, which is accounted for in your S&P/GDP measure, and after 10% corrections.
Summary
Use leverage wisely by having exposure in a silo via a home equity line of credit without other leverage. Using leverage in this capacity is opportunistic and could lead to much higher after-tax returns to enhance portfolio growth.
No comments:
Post a Comment